Logs and metrics
Follow what your services do.
Logs
A project's Logs tab shows the output (stdout and stderr) of all its services in one time-ordered list.
- Narrow it by service, instance, level and text.
- Live mode keeps following across deploys and restarts.
- Download the loaded lines.
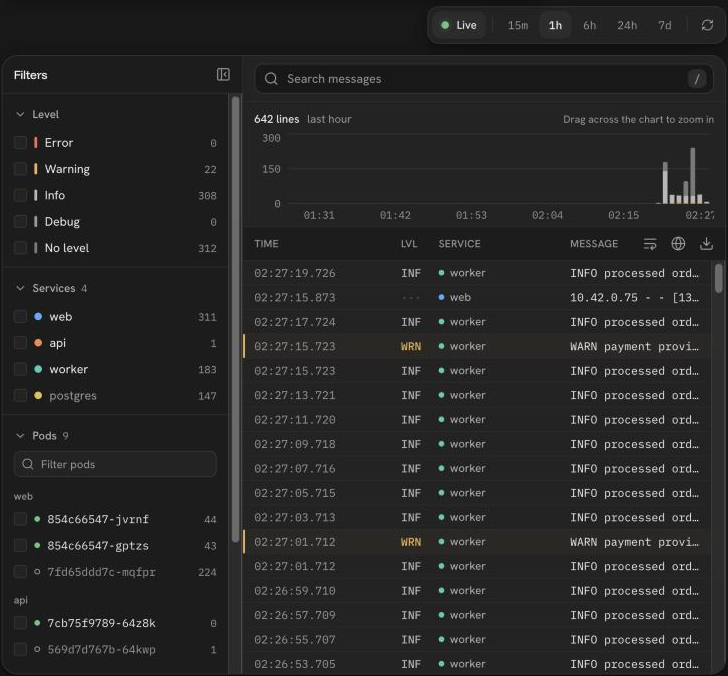
Logs are kept 7 days or up to 2 GiB, whichever comes first, on the server's own disk. A service that writes more than 2,000 lines per second is throttled.
Metrics
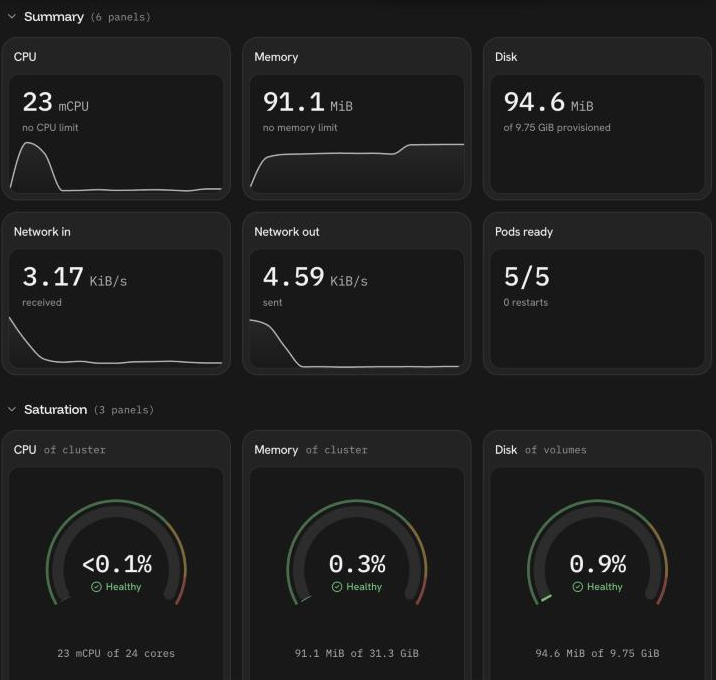
A project's Usage Metrics tab shows, over a selected time range:
- CPU, memory, network and disk I/O per service;
- the fill level of volumes;
- for projects with databases: connections, transactions per second, cache hit ratio and database size.
Metrics are kept 14 days on the server's own disk.
Audit log
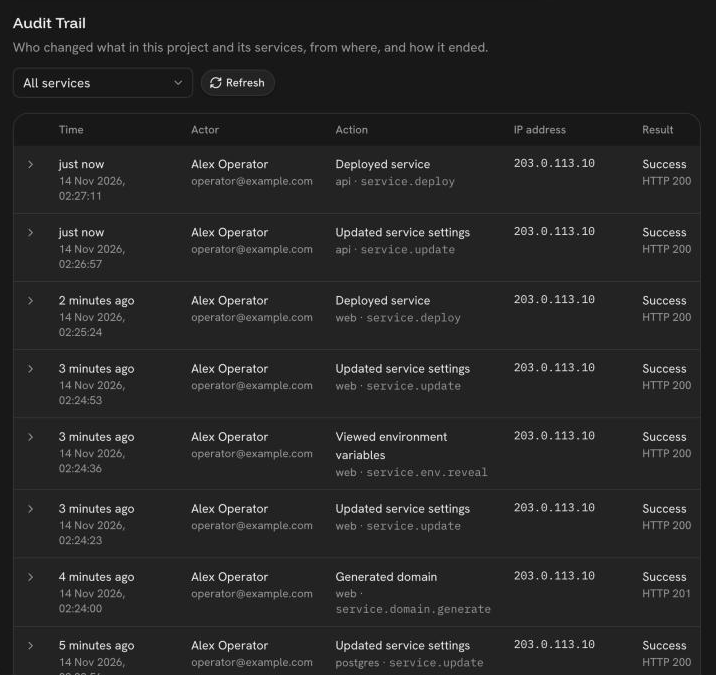
The Audit Trail tab lists who changed what in the project and its services, from where, and when: deploys, setting changes, revealed secrets and opened terminals.
Was this page helpful?
Last updated on